Data diagnostics
Horace contains various tools for diagnosing issues with the data. The foremost of these is the run_inspector tool.
If you wish to decompose an sqw object into the data from its constituent runs, the split routine outlined below can be used. After manipulation (if necessary), such data can then be recombined using the join routine.
run_inspector
The run_inspector routine may be used on 1d or 2d sqw objects to plot the data from each individual run.
run_inspector(w)

run_inspector(w,'ax',[-5,4,0,370])

run_inspector(w,'ax',[-5,4,0,370],'col',[0,1])
The 'ax' and 'col' arguments allow you to specify the xy axes, and the colour scale, of the resulting plots. If these options are not set then each frame will be plotted with different (tight) axes and a different colour scale.
To toggle through the frames, there are several keyboard options:
Enter (Return) - play/pause video (5 frames-per-second default).
Backspace - play/pause video a factor 5 slower.
Right/left arrow keys - advance/go back one frame.
Page down/page up - advance/go back 10 frames.
Home/end - go to first/last frame of video.
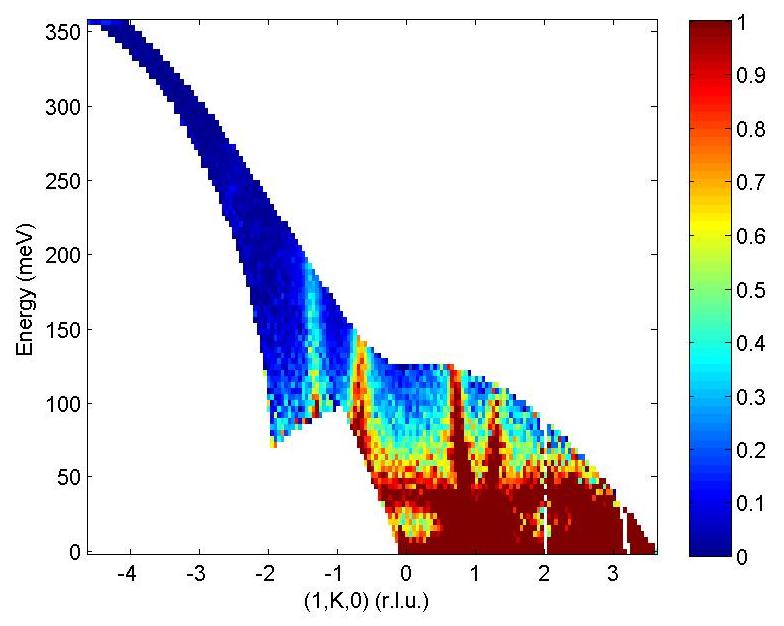
Let us illustrate the information that may be obtained by means of an example. First we generate a QE slice such as the one below

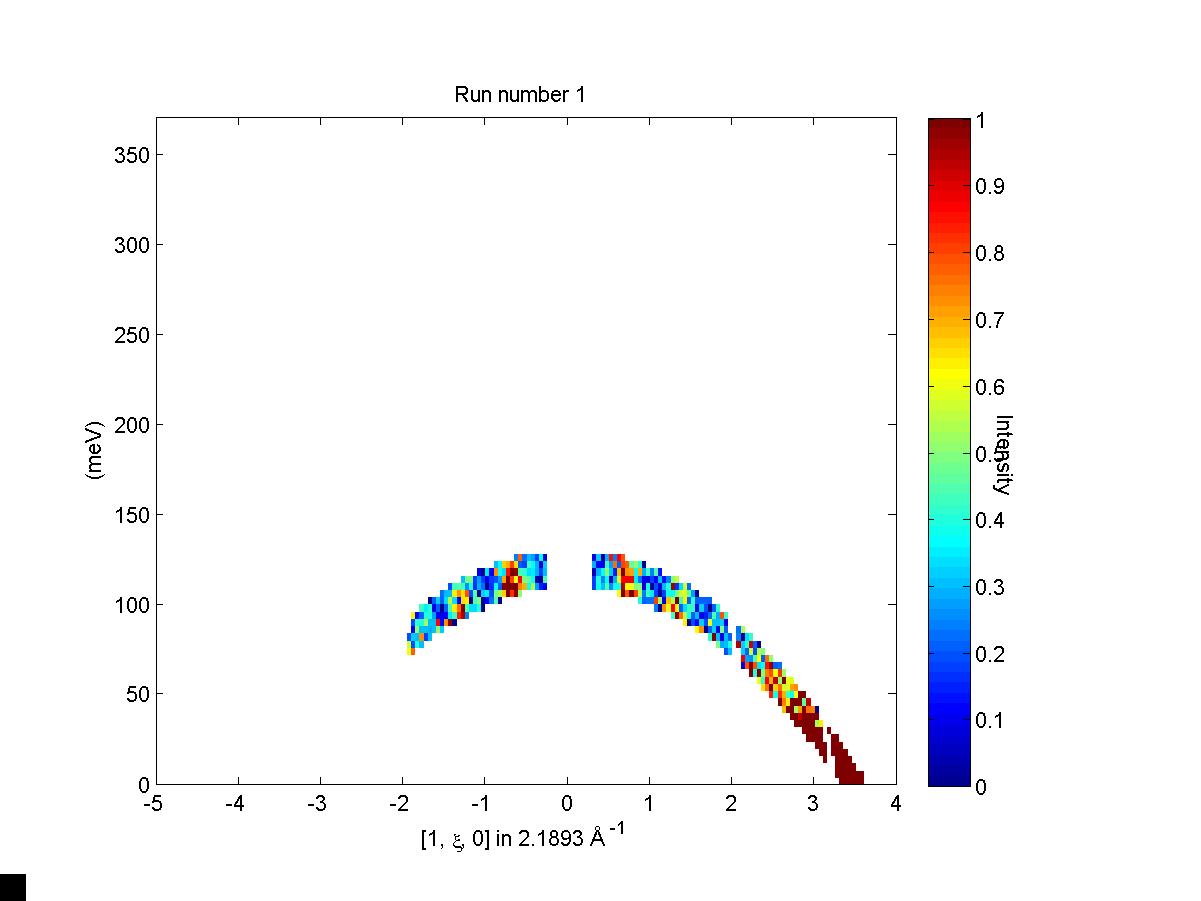
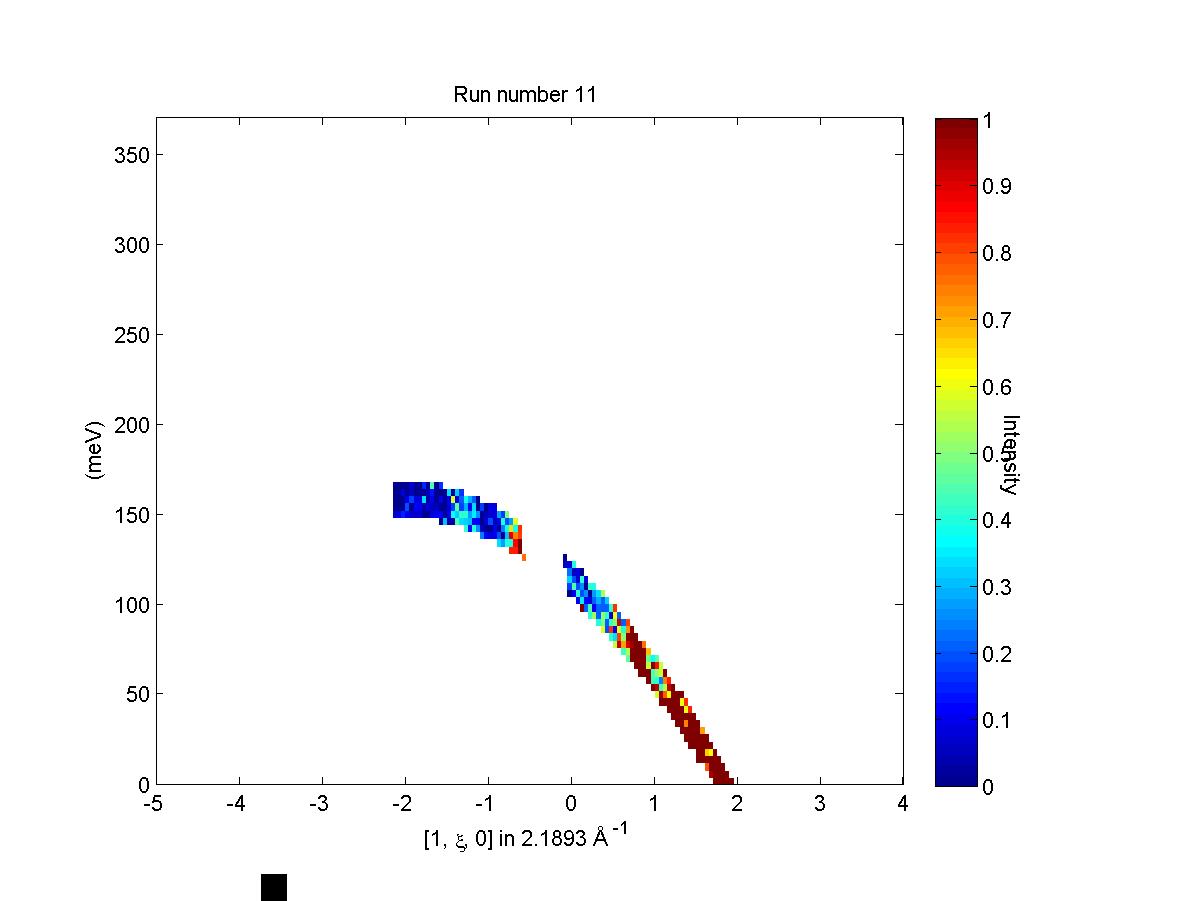
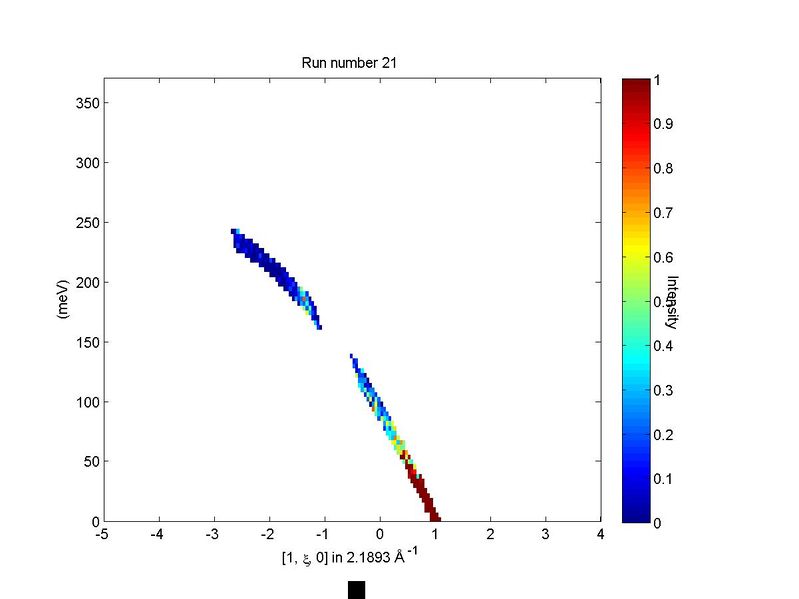
We can now use run_inspector to plot a series of slices that come from a single contributing dataset, shown below.


split
Split an sqw object into an array of sqw objects, each containing data from a single contributing run. So if your dataset comprises information from 100 runs, the output will be a 100-by-1 array of sqw objects.
wout=split(w)
join
Inverse of split - takes an array of sqw objects that have been created using split and recombines them.
wout=join(w,wi)

wout=join(w)
The inputs are:
w - an array of sqw objects, each one made from a single spe data file
wi - the initial pre-split sqw object (optional, recommended).
The output is:
wout - an sqw object Mex_C++_glnxa64.